Defying gravity, 2022 Climate Tech VC funding totals $70.1B, up 89% on 2021.

3,300+ global venture funding rounds delivered $70.1B of Climate Tech VC investment in 2022, nearly double 2021's record total.

Climate Tech Intelligence Unit

calendar image
January 3, 2023

Global Climate Tech Venture Capital had an exceptionally strong 2022 delivering $70.1B of investment, defying gravity in a broader market that has fallen significantly. Expect 2023 to moderate amid a challenging economic backdrop, however Climate Tech will enjoy preferential allocation and has mobilized a focused investor base competing for quality flow.

2022 was an enormous year for Climate Tech VC. The US invested more Climate Tech VC in 2022 than the entire 2006-2011 Clean Tech 1.0 Boom and at the current pace of investment, by the end of 2023, the US will have invested over $100B in VC since then. Europe's venture funding into Climate Tech more than doubled in 2022, out investing China for the first time and together with a huge rise in India and around the world, grew 89% globally on 2021's record.

HolonIQ's quarterly wrap on Climate Tech VC is based solely on our proprietary impact intelligence platform. All data is sourced directly by HolonIQ technology and analysts from public disclosures and private submissions by governments, companies and investors around the world. This analysis is focused exclusively on venture capital and as such we exclude all private equity buyouts, corporate subsidiary funding, project finance, public funding, grant and academic funding to ensure we are primarily tracking flows of venture focused equity risk capital.

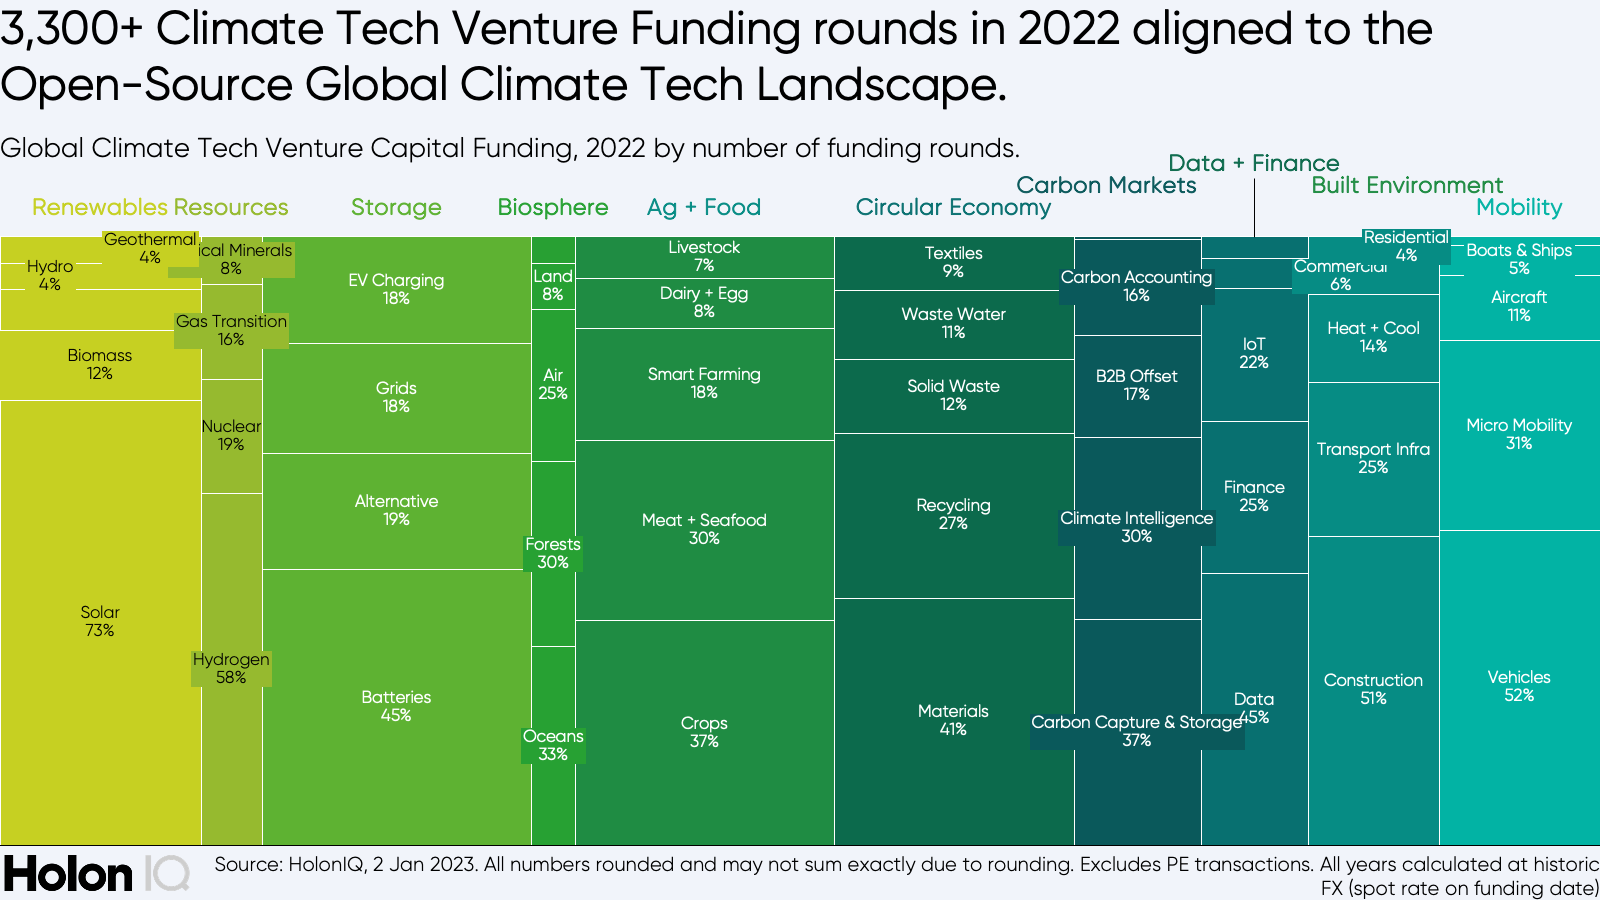
Climate Tech Venture investment is now 40x larger than it was a decade ago. With innovation surging across the entire Climate Tech Landscape, notable mega rounds included 🇸🇪 Northvolt's $1.1B growth round, 🇺🇸 TeraWatt’s $1.0B Series A, 🇺🇸 TerraPowers $750M+ growth round, 🇨🇳 RT Advanced Materials $740M, 🇨🇳 Voyah's $700M Series A, 🇨🇭Climework's $650M growth round and 🇺🇸 EnergyX's $450m growth round joining 160+ other companies that closed a $100M+ Mega Round in Climate Tech through 2023.

As of 2 January 2023, there are 83 Climate Tech Unicorns around the world who are now collectively valued at $180B+. 2022 saw a new Climate Tech Unicorn every two weeks on average, with a range of public market exits, SPACs a popular route as the traditional IPO proved challenging more broadly.

Figure 1

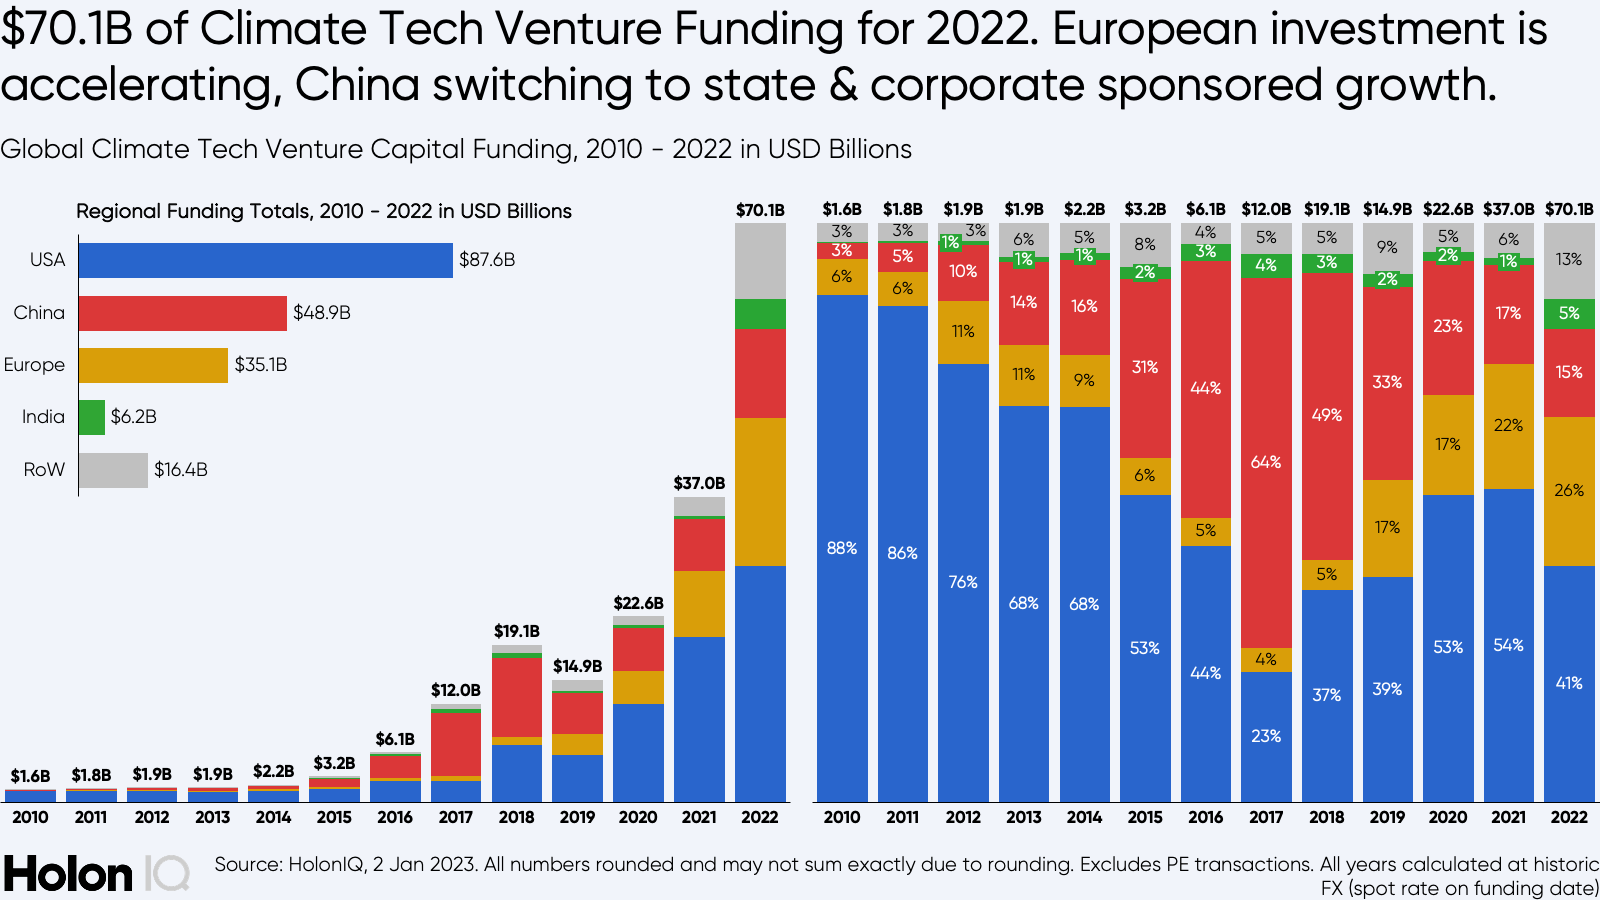
Global growth of 89% in Climate Tech VC was achieved through growth in all major markets. The US leads VC investment in Climate Tech today, taking over from China in 2019 as regulatory changes have enabled state sponsored and corporate companies to effectively take over from traditional VC's who now invest alongside those corporations.

The US has seen strong investment momentum quite recently and by mid to late 2023, the US alone will have invested over $100B of VC into Climate Tech since 2010. The original Clean Tech Boom from 2006 to 2011 saw investors commit $25B+ of VC. With such a strong wave of Climate Tech VC through 2022, the comparison with Clean Tech 1.0 will diminish, so long as this wave is sustained.

Figure 2

2023 Climate Tech Expectations

Please take 2 minutes to share your expectations on Climate Tech for 2023. Respondents will receive the survey results ahead of public release.

The Open-Source Global Climate Tech Landscape is our primary reference for a granular understanding of the trends and patterns emerging in Climate Tech. Leveraging new charts and analytics on HolonIQ's Intelligence Platform, we are now able to explore high granularity patterns and trends with 'X-Ray Charts' in HolonIQ's data analytics studio, adjusting for different time frames and geographic dimensions to see the anatomy and composition of insights over time.

Figure 3 shows an 'X-Ray Chart' to see the underlying share of each cluster of the Global Climate Tech Landscape, aligned to the sub-sectors shown in figure 2 and below colored as different columns of that chart. Within each sub-sector/column, the clusters are revealed to show their share of the 3,300+ Climate Tech Venture funding rounds that occurred through 2022.

Figure 3

From left to right across the taxonomy by sub-sector in each color and by VC deal count, we see Renewables was dominated by Solar. Alternative Resources are smaller by number although they're outsized as revealed in a 'dollars' perspective due to a lower volume of higher value investments in Nuclear, Hydrogen and Critical Minerals. In Storage and Distribution we continue to see Batteries dominate followed by Alternative Storage technologies (non Battery), Energy Grids for distribution and EV Charging all representing substantial numbers of investments.

The Biosphere sub-sector is under-represented in VC investment, although we're seeing an acceleration in solutions addressing Land Capital, Air Quality, Forest preservation and restoration, and Oceans and Water solutions. The Food System is broadly represented by upstream agricultural and alternative products, excluding retail and distribution. Alternative Meat and Seafood, Dairy and Egg, Smart Farming and technology to support Crops and Livestock mitigation and adaptation were all well funded through 2022. In the Circular Economy, investment was dominated in Sustainable Materials, followed by Recycling, Solid and Wastewater and Textiles alternatives/enhancements are also gaining share.

Carbon markets have seen a boom since 2021 levels, whether in Capture, Storage, Offsets or Accounting. We see the world evolve around Climate Data and Finance including our IoT (Internet of Things) cluster that will shortly be re-framed to capture earth observation and measurement spanning to include from smaller IoT enabled hardware in the environment to space based observation and other environmental observation, measurement and tracking devices and systems.

Construction and Transport Infrastructure dominate the built environment technologies, with Commercial and Residential buildings, Heating and Cooling solutions rounding out a well funded sub-sector. Finally in Mobility, Vehicles (cars, trucks and motorcycles) continue to be a very popular category. Micro-mobility is maturing and in emerging markets has strong continued momentum, along with innovations across electric and eVTOL aircraft, electric and hydrogen/wind powered boats and ships and next generation rolling stock and trains.

Figure 4

In figure 4, and beyond the activity levels of funding rounds, the 'X-Ray' above shows how the funding was distributed in USD (figure 3 represents share of deals, figure 4 represents share of dollars). This perspective is of course skewed by large mega-funding rounds (160+ in 2022) and as such can form a very different representation to that of funding rounds/count.

The key difference between our 'X-Ray' in figure 3 and figure 4 is clearly visible in the Storage and Mobility sub-sectors and to some extent in Data and Finance.

In storage, we see just how much of the total dollar value is being captured across that sub sector and how Batteries are really taking an outsized share of that market's investment. Another area over represented in $1 perspective versus the number of deals is in Mobility, similarly here we see vehicles taking the major share of that, aircraft attracting more dollars than deals. Conversely, the data and finance category appears to have captured a lower share of dollars than the number of deals which is representative of the asset diversity in Climate Tech, The data and finance sub-sector is principally B2B SaaS versus other more physical asset/infrastructure sub-sectors that a more capital intensive. Data and Finance is also a younger sub-sector compared to many others and as such is at an earlier stages of development.

Ready to get started?

Get a personalized walkthrough of HolonIQ's Global Intelligence Platform.

As we look at geographic trends, we see the US continue a very strong rise in investment adding an additional six to eight billion of VC every year to Climate Tech since 2019. As previously mentioned, the US invested more venture funding into Climate Tech in 2022 alone than in the entire Clean Tech boom 1.0 (2006 to roughly 2011). At some point, mid to late 2023 and subject to investment levels through 2023, the US will have invested $100 billion since the clean tech boom 1.0.

In Europe, we've seen the fastest growth, it has more than doubled investment in 2021, reaching nearly $18 billion. Europe is arguably the most progressed market from a policy and regulatory perspective around climate technology, and that's supporting an acceleration in VC flows in the region combined with an energy crisis and major geopolitical shifts.

China, has grown significantly on 2021, adding over $4B USD in VC to Climate Tech but lost share due to state sponsored and corporate entities taking the leading role in funding innovation and technology.  

2022 marked a massive surge in India based VC funding as the region mobilizes around sustainability and transitions from a consumer focused venture capital environment now to climate tech  the preferred investment category. Indian policy makers, corporates and investors alike see the potential for India to take a leadership role in climate tech across the region and around the world.

Figure 5

Finally, when we look at all major geographic markets combined, below in figure 6, from around 2010 we see US led Climate Tech investment moderate in the wake of the 'Clean Tech 1.0' boom. Towards the middle of that decade, China starts a significant wave of investment that outpaces the US on a relative basis, ultimately making up 64% of global Climate Tech VC investment in 2017, after which China enters into a new regulatory environment and a number of major Chinese climate technologies reach a new level of maturity that are now funded by state owned enterprises and private corporates.

Since 2018/2019 all major markets have seen aggressive investment in Climate Technology, defined more broadly than its Clean Tech predecessor, and with a greater sense of urgency, government support and a more mature set of energy and environmental technologies.

Figure 6

Check back each week for more data-driven insights on the Global Climate Tech Economy.

No items found.

Latest Insights

Global Insights from HolonIQ’s Intelligence Unit. Powered by our Global Impact Intelligence Platform.

Newsletter
Newsletter
2024 Back to School
2024 Back to School
North America EdTech 200
2024 Paris HE Summit
2024 San Juan Speaker
Indices
Indices
Cities
Cities
2023 Back to School Featured Speaker
New York
New York
2023
2023
Webinar
Webinar
Economics
Economics
Draft
Draft
Platform
Platform
2022
2022
Digital Transformation
MedTech
MedTech
Global Impact Summits
Impact 3000
Impact 3000
Nuclear
Nuclear
Mobility
Mobility
Electric Vehicles
Electric Vehicles
2021
2021
2020
2020
Sub Saharan Africa
Sub Saharan Africa
Nordic Baltic
Nordic Baltic
North America
North America
South Asia
South Asia
East Asia
East Asia
ANZ
ANZ
Market Sizing
Market Sizing
Augmented Reality
Augmented Reality
Blockchain
Blockchain
Virtual Reality
Virtual Reality
Regions
Regions
Markets
Markets
Mobile
Mobile
Client Report
Client Report
Publishers
Publishers
Labor Markets
Labor Markets
Global Landscape
Global Landscape
10 Charts Series
10 Charts Series
R&D
R&D
LMS
LMS
United Kingdom
United Kingdom
Executive Panel
Executive Panel
Language Learning
Language Learning
Russia
Russia
Israel
Israel
Germany
Germany
France
France
Media and Press
Media and Press
Climate Tech
Climate Tech
MENA
MENA
South Korea
South Korea
Japan
Japan
Southeast Asia
Southeast Asia
Health Tech
Health Tech
Global EdTech 1000
Global EdTech 1000
Unicorns
Unicorns
MOOCs
MOOCs
Global Giants
Global Giants
Client Note
Client Note
Capital Markets
Capital Markets
Advanced Technology
Advanced Technology
OPM
OPM
International Education
India
India
China
China
Canada
Canada
Venture Capital
Venture Capital
Bootcamps
Bootcamps
Online learning
Online learning
Notes
Notes
Europe
Europe
Asia
Asia
Africa
Africa
LATAM
LATAM
Brazil
Brazil
Robotics
Robotics
Education in 2030
Education in 2030
Artificial Intelligence
SDG 17
SDG 17
SDG 16
SDG 16
SDG 15
SDG 15
SDG 14
SDG 14
SDG 13
SDG 13
SDG 12
SDG 12
SDG 11
SDG 11
SDG 10
SDG 10
SDG 9
SDG 9
SDG 8
SDG 8
SDG 7
SDG 7
SDG 6
SDG 6
SDG 5
SDG 5
SDG 4
SDG 4
SDG 3
SDG 3
SDG 2
SDG 2
SDG 1
SDG 1
Climate Tech 1000
Climate Tech 1000

Sign Up for our Newsletters

We provide you with relevant and up-to-date insights on the global impact economy. Choose out of our newsletters and you will find trending topics in your inbox.

Weekly Newsletter

Climate Technology

Weekly Newsletter

Education Technology

Weekly Newsletter

Health Technology

Weekly Newsletter

Higher Education

Daily Newsletter

Chart of the Day

Daily Newsletter

Impact Capital Markets